ONLINE SOFTWARE
The PS Analytical C210S007 Online software package has been designed and written to function with the complete product range of PS Analytical Online analysers. The Online software can be used to control up to two separate instruments simultaneously. The software is supplied as part of the package on all PSA’s online systems and is available as an optional item for stand alone PSA 10.525 Sir Galahad II systems which are used in a process configuration. The software has been designed to allow the system supervisor as much choice as possible when setting up user access levels and in determining system interactions to external connections. A tab screen format is utilised where each tab gives access to different functions within the software so that the supervisor can limit user’s access to only those screens and the particular functions to which they are allowed. Each user must log in before they can see/access the particular process that they have access to. Users can be individuals or members of a group. System diagnostics are always available and the user is able to check the system with the aid of a visual representation of the analyser (Instrument mimics). The mimic shown depends on the analyser used with the OnLine software. The mimic changes to show schematically the sample and carrier gas flows through the system as the analytical cycles progress, together with the status of heaters (if any) and valves. For more details on the analytical cycle for your analyser, consult the relevant Instrument User Manual. At the left hand side of all instrument mimics is a representation of the sample inlet streams, showing which stream, by channel number, has currently been selected for analysis. Each channel is shown as a simple inlet stream – it does not display any complex multiple-valve arrangements that may be present. Four of the most common instrument mimics are shown below: |
|||
Online Natural Gas System |
Online Stack Gas System |
Continuous Flow Liquid System |
Discrete Flow Liquid System |
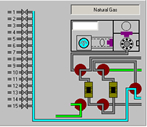 |
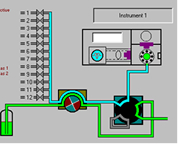 |
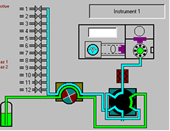 |
|
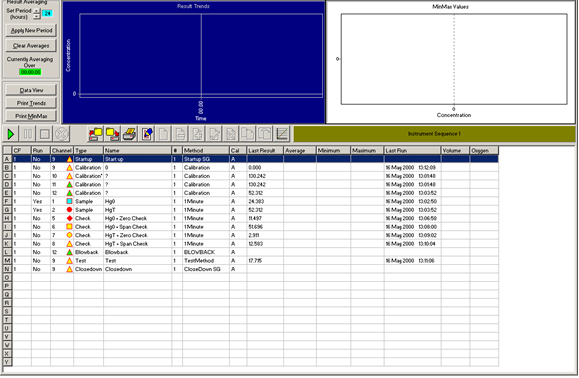
The main interaction is via the instrument sequence screen where the user can look at the latest results, see the last result and the maximum minimum and average results over a specified time period and can take particular sample streams in and/or out of the sequence. The user can also display the data either in a trend graph or a min/max/average style graph and is able to select which channels are shown. Calibration frequency can also be scheduled through this screen. A Typical Instrument Sequence Screen |
|||
 |
|||
AlarmsThe system can be configured to provide alarms for almost any event. Each alarm can be further specified to include which instrument and which channel raised the alarm. There are four groups of Alarm Types: Maximum/Minimum
|
|||


